Recycling Economics
Understanding the economics behind recycling can help us all make
better decisions on which products and packaging we choose to buy.
Here's what we recycle (%)
Chart
Table
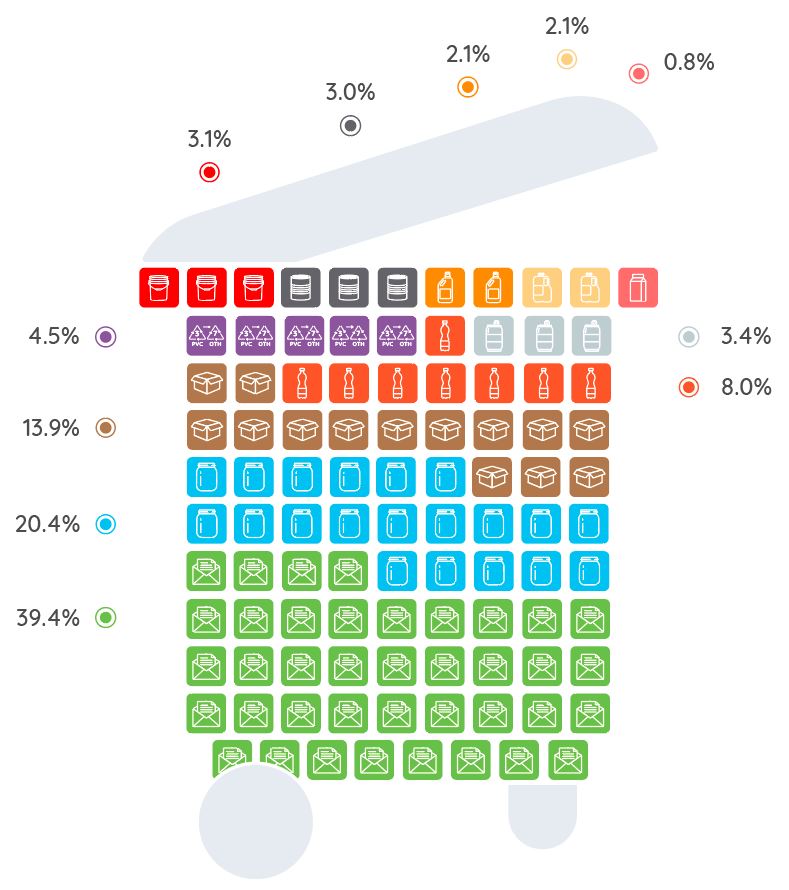
Estimate of Single-Family Household Recyclable Material Generation |
||
| Mixed Paper | 39.4% | |
| Glass | 20.4% | |
| OCC (Cardboard) | 13.9% | |
| PETE (#1) | 8.0% | |
| Plastics #3 thru #7 | 4.5% | |
| Aluminum & Foil | 3.4% | |
| Rigid Plastics | 3.1% | |
| Metal | 3.0% | |
| HDPE (#2) Colored | 2.1% | |
| HDPE (#2) Natural | 1.4% | |
| Aseptics & Cartons | 0.8% | |
% by weight |
100% |
|
Source: The Recycling Partnerhip's State of Curbside Report 2020
And here's the pricing ($/ton)
Chart
Table
Recyclable Material Pricing ($/ton)
As you can see prices vary widely and are constantly changing.
Recyclable Material Pricing |
||
| Aluminum & Foil | $1,675.00 | |
| HDPE (#2) Natural | $1,402.60 | |
| PETE (#1) | $301.00 | |
| HDPE (#2) Colored | $82.60 | |
| Metal | $168.13 | |
| Rigid Plastics | $6.20 | |
| OCC (Cardboard) | $71.88 | |
| Plastics #3 thru #7 | $14.40 | |
| Mixed Paper | $39.38 | |
| Aseptics & Cartons | $2.50 | |
| Glass | $-24.69 | |
Source: Recycling Markets.net
So here's the value ($)
Chart
Table
Blended Value of the Recyclable Material
= percentage (chart 1) x pricing (chart 2)
Blended Value of Recyclable Material |
|||||
| 3.4% | x | $1,675.00 |
= | $56.95 |
|
| 8.0% | x | $301.00 |
= | $24.08 |
|
| 1.4% | x | $1,402.60 |
= | $19.64 |
|
| 3.0% | x | $168.13 |
= | $5.04 |
|
| 13.9% | x | $71.88 |
= | $9.99 |
|
| 2.1% | x | $82.60 |
= | $1.73 |
|
| 3.1% | x | $6.20 |
= | $0.19 |
|
| 4.5% | x | $14.40 |
= | $0.65 |
|
| 39.4% | x | $39.38 |
= | $15.52 |
|
| 0.8% | x | $2.50 |
= | $0.02 |
|
| 20.4% | x | $-24.69 |
= | $-5.04 |
|
100% |
$128.78 |
||||